Articles

Affichage des articles du 2016

Read ... parameters in both function and interactive run

The ... parameter is very useful in a function but at the debugging stage it is boring because it generate an error in direct use. With this line, you will be able to use ... even in direct use without error: p3p <- tryCatch(list(...), error=function(e) list()) Let do some example. If you run this in interactive mode, you will get: > p3p <- tryCatch(list(...), error=function(e) list()) > p3p list() Now let use it within a function: > essai <- function(r, ...) { +   p3p <- tryCatch(list(...), error=function(e) list()) +   return(p3p) + } > essai() list() > essai(k=100) $k [1] 100 Original idea Marc Girondot with amelioration by Bert Gunter <bgunter.4567@gmail.com> and William Dunlap <wdunlap@tibco.com>.
Parallel computing in both windows and Unix computer

In the package parallel, a very useful function is mclapply(); it can be used directly as an lapply() but it runs the code in parallel in different cores. However, do not forget the to set the number of cores to be used because the default is only 2. Then you can do: options(mc.cores = detectCores()) system.time(out <- mclapply(as.list(1:10), FUN=function(x) {x*2})) or directly: system.time(out <- mclapply(as.list(1:10), FUN=function(x) {x*2}, mc.cores =  detectCores() )) However it does not work in Windows because forking cannot be used in windows. In windows you can use: options(cl.cores = detectCores()) cl <- makeCluster(getOption("cl.cores", 2)) # If you must use other package in the parallel function; use # invisible(clusterEvalQ(cl = cl , library(xxxxxx))) system.time(out <- parLapply(cl=cl, X=as.list(1:10), fun=function(x) {x*2})) stopCluster(cl)   Don't forget to stop the cluster before to open another one.

Take care to the span parameter if you use the loess() function

Image
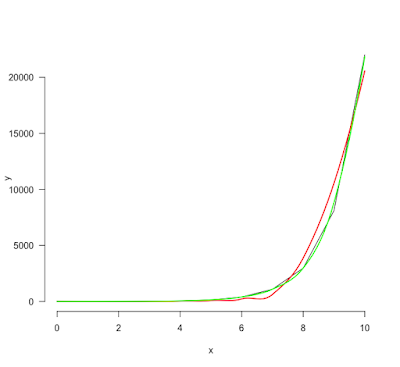
The loess() function permits to interpolate data with very few information about the data that you want interpolate. By default, the smoothing parameter (span) is set to 0.75. However this value is not always ideal. Look at these data. The data are very simple (exp(0:10)) but the span value at 0.75 is clearly not correct. A 0.5 value is much better.

On the distribution of the maximum

Image
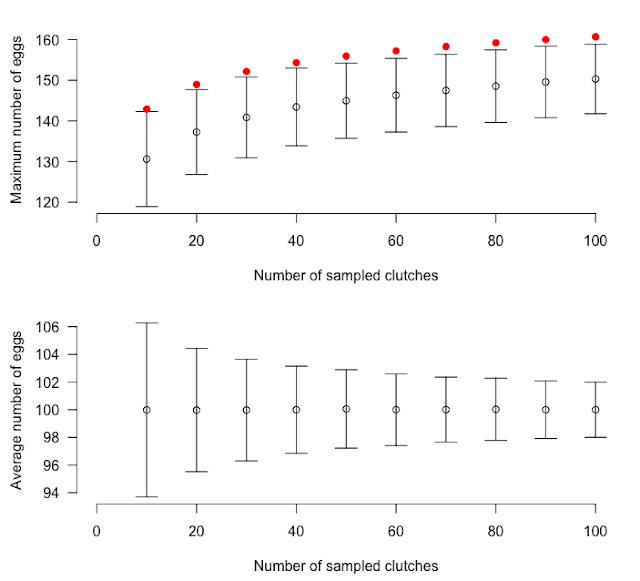
It is very tempting as a biologist (being an human) to claim that we have found the "biggest" of something. A typical exemple can be seen here: Fretey, J., A. H. Nibam, and D. Ngnamaloba. 2016. A new clutch size record from an olive ridley sea turtle nest in Cameroon. African Sea Turtle Newsletter 6:15-16. But as statistician, what can we say about the "maximum" ?

Install git2r from source on MacOSX Sierra

Install homebrew In terminal: brew install wget brew install openssl brew install  libssh2 cd ~/Downloads/ wget https://cran.r-project.org/src/contrib/git2r_0.21.0.tar.gz R CMD INSTALL --configure-args='--with-libssl-include=/opt/local/include --with-             libssl-lib=/opt/local/lib' git2r_0.21.0.tar.gz rm  git2r_0.21.0.tar.gz

Beautiful arrows

Image
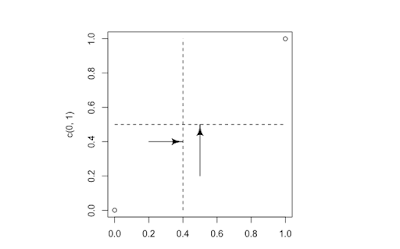
To plot beautiful arrows, use the "shape" package. The syntax is very close to the syntax of arrow() in grid package. To have the end of the arrow exactly at the (x1, y1) point, use the parameter arr.adj = 1 library("shape") plot(x=c(0, 1), y=c(0,1)) segments(x0 = 0, y0 = 0.5, x1 = 1, y1 = 0.5, lty = 2) Arrows(x0 = 0.5, x1 = 0.5, y0 = 0.2, y1 = 0.5, arr.adj = 1) segments(x0 = 0.4, y0 = 0, x1 = 0.4, y1 = 1, lty = 2) Arrows(x0 = 0.2, x1 = 0.4, y0 = 0.4, y1 = 0.4, arr.adj = 1)

bquote() in direct use for plot() or for a do.call(plot, ) use

The behavior of bquote() is different if it is used directly in a function or stored in a list to be used with de do.call(): Let try: > plot(1, 1, ylab=bquote(expr = "1000"^"-1")) > L <- list(x=1, y=1, ylab=bquote(expr = "1000"^"-1")) > do.call(plot, L) Error in "1000"^"-1" : argument non numérique pour un opérateur binaire The correct solution is to convert the bquote() as an expression: > plot(1, 1, ylab=as.expression(bquote(expr = "1000"^"-1"))) > L <- list(x=1, y=1, ylab=as.expression(bquote(expr = "1000"^"-1"))) > do.call(plot, L)

Difference between par(fig=c()) , par(mfrow=), par(mfcol=c()), and layout() to plot several plots in the same page

Image
There are several mechanisms that can be used to plot several plots in the same page. You can use mfrow(), par(fig=c()) or layout(). Trying the 3 different methods, a big difference has been noted that is not clearly stated in the documentation. layout() function and par(mfrow=) changes the par("cex") whereas par(fig=c()) does not change it. In the documentation of par: In a layout with exactly two rows and columns the base value of "cex" is reduced by a factor of 0.83: if there are three or more of either rows or columns, the reduction factor is 0.66. The change or not of par("cex") is important if mtext() is used because it does not used by default the par("cex") parameter. It must be forced to use it.

Again how to manage indices and exposants and variable name in plot legend

Image
labNames <- c('xLab','yLab') par(mar=c(4, 4, 1, 1)+0.4) scaley <- 100000 xlab <- as.expression(bquote(.(format(scaley, digits = 10, scientific = FALSE, big.mark = " ")) ~ x^2)) ylab <- as.expression(bquote(.(labNames[2]) ~ italic("Here in\" italic")^"-2" * "" [Essai])) L <- list(x=1:10,  xlab = xlab, ylab = ylab) do.call(plot, L) Try it; You will see how to use a regular R expression with .() How to put text in exposant with ^ How to paste text with * (no space between) or ~ (adding a space) How to put text in indice with [] How to stop exposant for next characters with * "" How to put text in italic with italic() How to add a " character with \" How to format large number with format()

Read the content of clipboard

For example, copy a able from excel and to get data, use: In windows: x <- read.table(file = 'clipboard', sep = '\t', header = TRUE) In macOSx: x <- read.table(file = pipe('pbpaste'), sep = '\t', header = TRUE)

Common legend for two plots

Image
With layout Impossible to put a common title correctly layout(mat=matrix(c(3, 1, 4, 2), ncol=2), heights = c(10, 90)) par(mar=c(4, 4, 1, 1)+0.4) plot(x = 1, y = 1, ylim = c(0, 2), xlim = c(0, 2), bty="n") points(x = 2, y = 2, col = "red") plot(x = 2, y = 2, ylim = c(0, 2), xlim = c(0, 2), bty="n") points(x = 1, y = 1, col = "red") par(mar=c(0, 0, 0, 0)+0) plot.new() text(x=1, y=0.5, labels = "Common title", cex=2, pos=2) plot.new() text(x=0, y=0.5, labels = "for both graphics", cex=2, pos=4) layout(1) With par(fig=c(x1, x2, y1, y2)) It is more easy to set up exact position of ploting region # restore all par() values to their defaults dev.off() plot.new() par(fig=c(0, 0.5, 0, 0.9)) par(mar=c(4, 4, 1, 1)+0.4) plot(x = 1, y = 1, ylim = c(0, 2), xlim = c(0, 2), bty="n") points(x = 2, y = 2, col = "red") par(fig=c(0.5, 1, 0, 0.9), new = TRUE) par(mar=c(4, 4, 1, 1)+0.4) plot(x

Variable in italic for plot title

Image
Here is an example how to plot a title in italic using a variable. layout(1) i <- "Caretta caretta" plot(1, main=substitute(expr = paste("Species name: ", italic(i)),                          env = list(i=i))) Or simpler: i <- "Caretta caretta" plot(1, main=bquote("Species name: "*italic(.(i))))

Plot on all the place of the window

Image
Let do a plot without any margin. The coordinates of the plot area are from 0 to 1 on both x and y axis. It can be changed with the xlim and ylim parameters. par(mar=c(0, 0, 0, 0)) plot(x=c(0, 1), y=c(0, 1), axes=FALSE,          xaxt="n", yaxt="n", main="",          xlab = "", ylab = "",          xaxs="i", yaxs="i", type="n") Here is an example on the use: lines(x=c(0, 1), y=c(1, 0), col="red") text(x = 0.5, y=0.5, pos=NULL, labels='The center')

Some examples of plotmath

Image
The plotmath expressions are never very easy to use. Here are some examples: plot(1:10, type="n", xaxt="n", yaxt="n", axes=FALSE, xlab="", ylab="") text(2, 8, expression(paste(bolditalic(p)^"*", '   expression(paste(bolditalic(p)^"*"))')), pos=4) text(2, 6, expression(paste(bolditalic(p)^textstyle("*"), '   expression(paste(bolditalic(p)^textstyle("*")))')), pos=4) text(2, 4, expression(paste(bolditalic(p)*"*", '   expression(paste(bolditalic(p)*"*"))')), pos=4)

Flush warnings() cache and convert warnings to error for debugging

Flush warnings assign("last.warning", NULL, envir = baseenv()) Convert warnings to error options(warn = 2)

Convert longitude/latitude formats from DMS to D.dec or DM.dec

Test of different packages to convert lo ng/lat data Package sp Several packages can do the job.  First, let use sp package. The orignal data can be in character string or in numbers. > library("sp") > essai <- char2dms(from="01d33'01.6\"N", chd="d", chm="'") > as.numeric(essai) [1] 1.550444 > essai <- char2dms(from="01°33'01.6\"N", chd="°", chm="'") Take care, the " character cannot be omitted: > essai <- char2dms(from="01°33'01.6N", chd="°", chm="'") > essai [1] 1d33'N > as.numeric(essai) [1] 1.55 Numeric data can be used directly using: > essai <- new(Class = "DMS", WS=FALSE, deg=1, min=33, sec=1.6, NS=TRUE) > essai [1] 1d33'1.6"N > as.numeric(essai) [1] 1.550444 And such DMS class object can be obtained from D.dec format using:

Install RnetCDF or ncdf4 on Ubuntu 14.04 64 bits

First install these libraries: sudo apt-get install libapparmor1 libcurl4-openssl-dev netcdf-bin libnetcdf-dev udunits-bin libudunits2-dev Then you can install ncdf4 or RnetCDF packages using the normal install commands within R

Fitting an ARIMA model with lme() (package nlme)

Image
An ARIMA model is one way to model time-series with two components, autoregressive and mobile average. See this post  Modèle ARMA et ARIMA . Let create a time series using both AR1 and MA1: set.seed(101) d <- data.frame(y=10,x=1:300) epsilon <- arima.sim(model = list(ar=0.9, ma=+0.2279), n = 300) d$y <- d$y + epsilon layout(matrix(1)) plot(d$x, d$y, bty="n", las=1, pch=19, cex=0.5)

Theoretical numbers to superimpose on histogram

Image
If you want superimpose the theoretical numbers at the top of an histogram based on a fitted distribution (for example, using fitdistrplus()), it is not so easy. Here is a generic function for such a purpose. It is integrated in my package HelpersMG : modeled.hist <- function(breaks, FUN, ..., sum=1) {   # breaks is a vector with the breaks; it can be obtained directly from hist()   # FUN is the function to integrate the density, ex. pnorm   # ... are the parameters of pfun   # sum is the total numbers in the histogram; 1 for emperical frequencies   by <- breaks[2]-breaks[1]   xp <- c(breaks, tail(breaks, 1)+by)   par.fun <- list(...)   par.fun <- modifyList(list(log.p=FALSE, q=xp, lower.tail=TRUE),                          par.fun)   s <- do.call(FUN, par.fun)   # s <- pfun(xp, par.fun[1], par.fun[2], log=FALSE)   s <- head(c(s[-1], 0)-s, length(breaks))   return(list(x=breaks+by/2, y=s*sum)) }

Thicks for log scale

Image
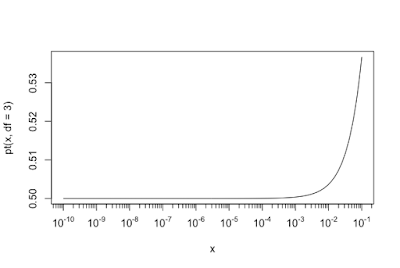
if(!require("sfsmisc")) install.packages("sfsmisc") require("sfsmisc") x <- lseq(1e-10, 0.1, length = 201) plot(x, pt(x, df=3), type = "l", xaxt = "n", log = "x") eaxis(1)

Example of Mantel test to compare dissimilatry matrices

Image
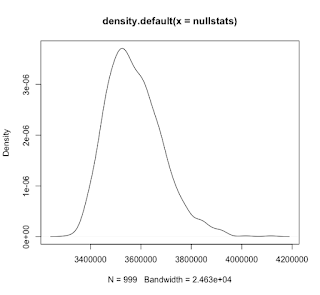
A Mantel test measures the correlation between two matrices typically containing measures of distance.  A Mantel test is one way of testing for spatial autocorrelation. Example of R code: library("vegan") library("fields") library("sp") # Random points points <- as.matrix(data.frame(longitude=rnorm(20, 3, 2), latitude=rnorm(20, 23, 2))) caracteristiques <- rnorm(20, 12, 3) plot(x=points[,"longitude"], y=points[, "latitude"], pch=19, cex=2*caracteristiques/max(caracteristiques)) # matrice des distances euclidiennes de caractéristiques disC <- rdist(x1=caracteristiques) # Matrice de distances entre les points basée sur la distance terrestre disL <- spDists(x=points, longlat = TRUE) plot(disL, disC) MT <- mantel(xdis=disC, ydis=disL, method="pearson", permutations=999) MT

Runge-Kutta algorithm

Image
Test of the Runge-Kutta algorithm and comparison with implementation within the deSolve package or the approximation dy -> 0. The code for Runge-Kutta algorithm has been done by Maxime Jacquemin (ESE, University Paris Sud). It does a little bit better that the deSolve code but very little.

Execution time for seq_along(x) versus 1:length(x)

A little advantage for seq_along(): l> sibrary(embryogrowth) > system.time(for (i in 1:100000) seq_along(NestsResult)) utilisateur     système      écoulé       0.117       0.012       0.131 > system.time(for (i in 1:100000) 1:length(NestsResult)) utilisateur     système      écoulé       0.143       0.005       0.148

Spark 1.6.1, and SparkR install and use in MacOSX or Linux

With the help of Julien Nauroy (DI Université Paris Sud) and Maxime Jacquemin (ESE Université Paris Sud) __________________________________________________________________________ To install SparkR, first go there: https://spark.apache.org Download the Spark software choosing these options: - Most recent spark release (1.6.1 at the time of this post written) - Prebuilt for Hadopi 2.6 and later - Direct download You will get a file spark-1.6.1-bin-hadoop2.6.tar in your download folder. Untar it and then you will have a folder: spark-1.6.1-bin-hadoop2.6 Copy this folder in a safe place, for example: ~/Documents/spark-1.6.1-bin-hadoop2.6 ________________________ Two solutions to install the package: library("devtools") Sys.setenv(SPARK_HOME = "~/Documents/spark-1.6.1-bin-hadoop2.6") install(file.path(Sys.getenv("SPARK_HOME"), "R", "lib", "SparkR")) or e nter these commands in R: Sys.setenv(SPARK_HOME =

Efficient way to remove first and last elements of a vector

Three different ways to remove first and last elements of a vector are compared. The winner is without contest: v[-c(1, length(v))] > v <- 1:100 > head(v[-1], -1)  [1]  2  3  4  5  6  7  8  9 10 11 12 13 14 15 16 17 18 19 20 21 22 23 24 25 26 27 28 29 30 [30] 31 32 33 34 35 36 37 38 39 40 41 42 43 44 45 46 47 48 49 50 51 52 53 54 55 56 57 58 59 [59] 60 61 62 63 64 65 66 67 68 69 70 71 72 73 74 75 76 77 78 79 80 81 82 83 84 85 86 87 88 [88] 89 90 91 92 93 94 95 96 97 98 99 > rev(rev(v[-1])[-1])  [1]  2  3  4  5  6  7  8  9 10 11 12 13 14 15 16 17 18 19 20 21 22 23 24 25 26 27 28 29 30 [30] 31 32 33 34 35 36 37 38 39 40 41 42 43 44 45 46 47 48 49 50 51 52 53 54 55 56 57 58 59 [59] 60 61 62 63 64 65 66 67 68 69 70 71 72 73 74 75 76 77 78 79 80 81 82 83 84 85 86 87 88 [88] 89 90 91 92 93 94 95 96 97 98 99 > v[-c(1, length(v))]  [1]  2  3  4  5  6  7  8  9 10 11 12 13 14 15 16 17 18 19 20 21 22 23 24 25 26 27 28 29 30 [30] 31 32 33 34 35 36 37 38 39 40 41 42 43

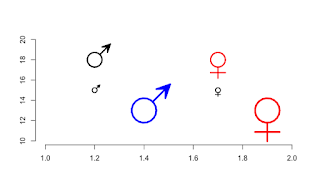
Elegant male and female symbols in R plot region

Image
The trick shown here ( http://max2.ese.u-psud.fr/epc/conservation/Girondot/Publications/Blog_r/Entrees/2013/10/22_Males_and_females_symbols.html ) to draw males and females symbols produces ugly symbols. Here are more elegant drawings if you need them in the plot region. These two functions are included in the package HelpersMG. symbol.Male <- function(centerx, centery, rayonx, lwd=2, col="black") { xr <- ScalePreviousPlot()$xlim["range"] yr <- ScalePreviousPlot()$ylim["range"] ratio <- par("pin")[1]/par("pin")[2] rayony <- rayonx*(yr/xr)*ratio angle <- seq(from=0, to=2*pi, length.out = 20) x <- centerx+rayonx*cos(angle) y <- centery+rayony*sin(angle) segments(x0=x, y0=y, x1=x[c(20, 1:19)], y1=y[c(20, 1:19)], col=col, lwd=lwd) x0 = centerx+rayonx*sqrt(2)/2 y0 = centery+rayony*sqrt(2)/2 x1 = centerx+3*rayonx*sqrt(2)/2 y1 = centery+3*rayony*sqrt(2)/2 segments(x0=x0, y0=y0, x1=x1, y1=y1, col=co

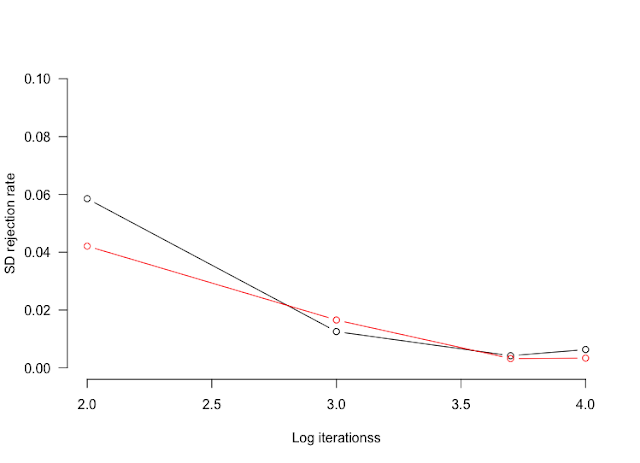
Rejection rate in Metropolis-Hastings algorithm

Image
During the Metropolis-Hastings algorithm run, the rejection rate should be 0.234. Bédard M. (2008) Optimal acceptance rates for metropolis algorithms: Moving beyond 0.234. Stochastic Processes and Their Applications, 118(12), 2198-2222. Such a value can be achieved by change of SD proposition parameter for each prior. However it can can tedious to estimate the correct value if each run takes a long time to finish. However, to get correct rejection rate needs much less iterations than to get correct SD values. Here I will show that with as few as 1000 iterations (10^3),  it is possible to estimate rejection rate with a 95% confidence interval at ±0.04. library(HelpersMG) # 30 random numbers from Gaussian distribution  x <- rnorm(30, 10, 2) # Likelihood function dnormx <- function(data, x) {   data <- unlist(data)   return(-sum(dnorm(data, mean=x['mean'], sd=x['sd'], log=TRUE))) } # Where all the results will be stored RR <

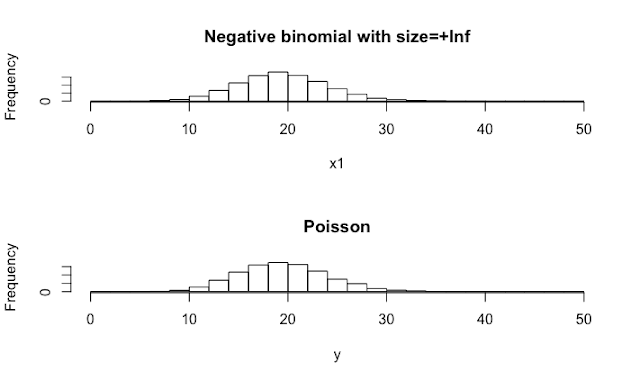
Negative binomial and Poisson distributions

Image
It is known that Poisson distribution is a special case of Negative binomial distribution. But how to parametrize NB to make it similar to Poisson in R ? It is simple: rnbinom(n, mu=m, size=+Inf) is similar to rpois(n, lambda=m). Try this to be sure ! layout(mat = 1:2) x1 <- rnbinom(10000, mu=20, size =+Inf) hist(x1, breaks=seq(from=0, to=50, by=2), main="Negative binomial with size=+Inf") y <- rpois(10000, lambda=20) hist(y,  breaks= seq(from=0, to=50, by=2), main="Poisson") Or this: > dnbinom(x = 20, mu=20, size=+Inf) [1] 0.08883532 > dpois(x=20, lambda=20) [1] 0.08883532

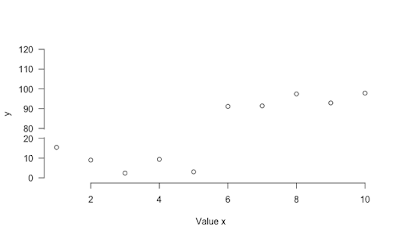
plot with broken y-axis

Image
Here is a function to implement broken y-axis. Several enhancements could be done to make it nicer but it works. However it was not fully tested.

Equivalent of inc(x) or x++ in R

Let try different solutions to mimic C operand ++ to have the most efficient.

Efficient way to remove names of vector elements

Sometimes you must remove names of elements within a vector. The most classic way to do is to use unname() function. However, the use of as.numeric() or as.character() is more efficient if you know the content of the vector. In conclusion, to remove names, it is 5 times more rapid to use as.integer(), as.character(), as.numeric() or as.logical(). i <- c(Pi=pi) system.time(for (j in 1:100000) k <- unname(i)) utilisateur     système      écoulé        0.171       0.002       0.174  system.time(for (j in 1:100000) k <- as.numeric(i)) utilisateur     système      écoulé        0.030       0.000       0.029    i <- c(Pi=3) system.time(for (j in 1:100000) k <- unname(i)) utilisateur     système      écoulé        0.169       0.003       0.174  system.time(for (j in 1:100000) k <- as.integer(i)) utilisateur     système      écoulé        0.028       0.000       0.028    i <- c(Pi="pi") system.time(for (j in 1:100000) k <- unname(i)) utilisateur    

Further information on efficient concatenation

Image
In a previous post ( http://biostatsr.blogspot.fr/2016/02/comparison-of-methods-to-concatenate.html ), I showed that the use of c <- c(c, x) for concatenation was not efficient at all. Now I study if the efficiency depends on the length of the c object. Vector c <- NULL t <- NULL for (j in 1:40) {     t <- c(t, system.time(         for (i in 1:1000) c <- c(c, pi)     )[1])      } plot(1:40, t, bty="n", las=1, ylim=c(0, 0.4), xlim=c(1, 40)) And the answer is clearly: YES ! The longer the vector c is, the more time it takes to add a new element. And this effect is of course not observed if replacement inside a vector object is done. Note that the y-scales are not the same. c <- rep(NA, 40000) t <- NULL for (j in 1:40) {     t <- c(t, system.time(         for (i in 1:1000) c[(j-1)*40+i] <- pi     )[1])      } plot(1:40, t, bty="n", las=1, ylim=c(0, 0.005), xlim=c(1, 40)) Or better: c <- rep(NA, 40

Make a matrix being symmetric

A symmetric matrix can be useful is many context and it is good to be able to generate such a matrix. Here are several solutions. The most complete function was  symmetricize()  available in the discontinuited package ENA. I copy the function from this package to my package HelpersMG to make it again available: Matrix library > library(Matrix) > essai <- matrix(data = 1:25, nrow = 5) > > forceSymmetric(x=essai, uplo="U") 5 x 5 Matrix of class "dsyMatrix" [,1] [,2] [,3] [,4] [,5] [1,] 1 6 11 16 21 [2,] 6 7 12 17 22 [3,] 11 12 13 18 23 [4,] 16 17 18 19 24 [5,] 21 22 23 24 25 gdata library > essai <- matrix(data = 1:25, nrow = 5) > essai      [,1] [,2] [,3] [,4] [,5] [1,]    1    6   11   16   21 [2,]    2    7   12   17   22 [3,]    3    8   13   18   23 [4,]    4    9   14   19   24 [5,]    5   10   15   20   25 >  >  > diag(essai) <- 0 > library(&qu