Beautiful arrows
To plot beautiful arrows, use the "shape" package. The syntax is very close to the syntax of arrow() in grid package. To have the end of the arrow exactly at the (x1, y1) point, use the parameter arr.adj = 1
library("shape")
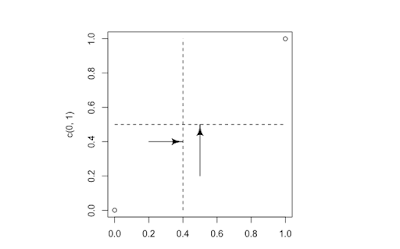
plot(x=c(0, 1), y=c(0,1))
segments(x0 = 0, y0 = 0.5, x1 = 1, y1 = 0.5, lty = 2)
Arrows(x0 = 0.5, x1 = 0.5, y0 = 0.2, y1 = 0.5, arr.adj = 1)
segments(x0 = 0.4, y0 = 0, x1 = 0.4, y1 = 1, lty = 2)
Arrows(x0 = 0.2, x1 = 0.4, y0 = 0.4, y1 = 0.4, arr.adj = 1)

Commentaires
Enregistrer un commentaire