Take care to the span parameter if you use the loess() function
The loess() function permits to interpolate data with very few information about the data that you want interpolate.
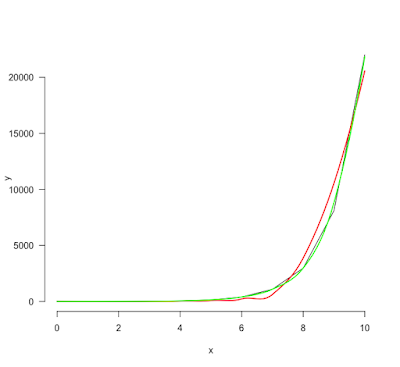
By default, the smoothing parameter (span) is set to 0.75. However this value is not always ideal. Look at these data. The data are very simple (exp(0:10)) but the span value at 0.75 is clearly not correct. A 0.5 value is much better.
x <- (0:10)
y <- exp(x)
df <- data.frame(x=x, y=y)
plot(x = x, y = y, type="l", bty="n", las=1)
lp <- loess(formula = y ~ x, data = df, span = 0.75)
newdata <- data.frame(x=seq(from=0, to=10, by=0.1))
p <- predict(object = lp, newdata)
lines(x = newdata$x, p, col="red", pch=19, lwd=2)
lp <- loess(formula = y ~ x, data = df, span = 0.5)
newdata <- data.frame(x=seq(from=0, to=10, by=0.1))
p <- predict(object = lp, newdata)
lines(x = newdata$x, p, col="green", pch=19, lwd=2)

In red, with span=0.75 and in green, with span=0.5.
The exact value that will fit your own purpose depends on the x-axis scale: the wider it is, the smaller must be the span value.
The exact value that will fit your own purpose depends on the x-axis scale: the wider it is, the smaller must be the span value.
Commentaires
Enregistrer un commentaire