Articles

Affichage des articles du 2019

Generate random distribution of truncated distribution

Imagine that you have estimated a sex ratio being 0.8 SE 0.2 by maximum likelihood. If you want make an histogram showing this distribution, the first idea is to do: > sr <- rnorm(100000, mean=0.8, sd=0.2) > sd(sr) [1] 0.2001526 > hist(sr) > sum(sr>1) [1] 15680 > sum(sr<0) [1] 3 The sd of sr is right 0.2 but clearly, it is not correct ! Let do a truncation: > sr <- sr[(sr>0) & (sr<1)] > hist(sr) > length(sr) [1] 84317 > sd(sr) [1] 0.1591352 The histogram is correct but the standard deviation is less than 0.2 due to the truncation. > sfinal <- NULL > x <- seq(from=1E-6, to=1, length.out = 100) > for (sigma in x) +   sfinal <- c(sfinal, abs(sd(sin(rnorm(100000, mean=2*asin(sqrt(0.8)), sd=sigma)/2)^2) - 0.2)) > plot(x, sfinal, type="l") > sigma <- x[which.min(sfinal)] > distribution_sr <- sin(rnorm(100000, mean=2*asin(sqrt(0.8)), sd=sigma)/2)^2 > hist(distribution_s
Variance of combination of variables

m1 <- 10 v1 <- 2 m2 <- 100 v2 <- 5 # var(x + y) = var(x) + cov(x, y) + var(y) # if the x and y variables are independent: # var(x + y) = var(x) + var(y) (v1 + v2) # If I use resampling c1 <- rnorm(100000, mean=m1, sd=sqrt(v1)) c2 <- rnorm(100000, mean=m2, sd=sqrt(v2)) var(c1+c2) # The resampling method can be used in most of the cases

Makevars

In ~/.r (base) marcgirondot@MacBook-Air-de-Marc .r % cat Makevars # The following statements are required to use the clang4 binary CC=/usr/local/opt/llvm/bin/clang CXX=/usr/local/opt/llvm/bin/clang CXX11=/usr/local/opt/llvm/bin/clang CXX14=/usr/local/opt/llvm/bin/clang CXX17=/usr/local/opt/llvm/bin/clang CXX1X=/usr/local/opt/llvm/bin/clang          LDFLAGS=-L/usr/local/opt/llvm/lib # End clang4 inclusion statements

system variable within R

To let R know about the compiler, we need to modify the ~/.Renviron. You may need to create the file by running in Terminal (Applications -> Utilities): touch ~/.Renviron Then, inside of ~/.Renviron add: PATH="/usr/local/clang7/bin:${PATH}" See http://thecoatlessprofessor.com/programming/r-compiler-tools-for-rcpp-on-macos/

Install previous version of a package

(the problem is solved with raster package; I keep this publication to show how to install previous version of a package) require(devtools) install_version("raster", version = "2.5-8", repos = " http://cran.us.r-project.org ")

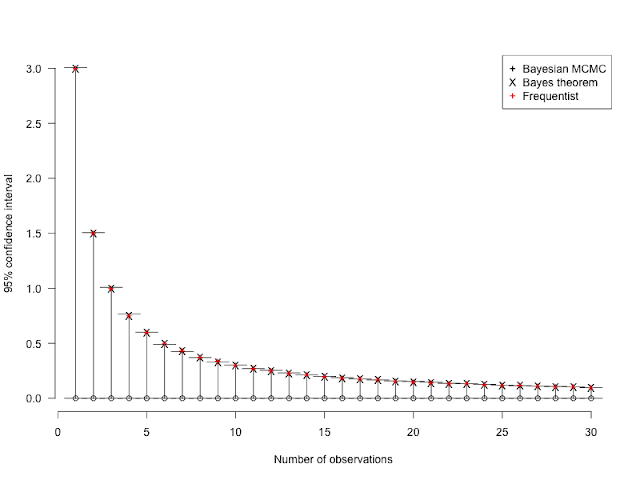
Confidence interval of 0 observations with Poisson distribution

Image
https://stats.stackexchange.com/questions/427019/confidence-interval-for-mean-of-poisson-with-only-zero-counts Excellent answer in this link about the confidence interval when only 0 observations are available for a Poisson distribution. Here is an alternative using Bayesian MCMC with uniform distribution. This is surprising how close are the estimates ! library(HelpersMG) u <- NULL for (l in 1:30) {   val <- rep(0, l)   prior <- data.frame(Density="dunif",                       Prior1=0, Prior2=10,                       SDProp=1,                       Min=0, Max=10,                       Init=0.01, row.names = "lambda")   mcmc_run <- MHalgoGen(n.iter=100000, parameters=prior, data=val, adaptive = TRUE,                         likelihood=dpoisx, n.chains=1, n.adapt=10000, thin=10, trace=FALSE)   u <- c(u, quantile(mcmc_run$resultMCMC$"1"[, "lambda"], probs=0.95)) } plot_errbar(1:30, rep(0, 30), y.minus=rep(0,

Install mark and RMark in Ubuntu 18.04

Enter this in terminal, and after you can install the package Rmark: cd /usr/local/bin sudo wget -U "Mozilla/5.0 (Macintosh; Intel Mac OS X 10_9_3) AppleWebKit/537.75.14 (KHTML, like Gecko) Version/7.0.3 Safari/7046A194A" http://www.phidot.org/software/mark/downloads/files/mark.64.zip sudo unzip mark.64.zip sudo rm mark64.zip sudo rm mark64.static sudo cp mark64.dynamic mark sudo rm mark64.dynamic sudo chmod +x mark sudo apt-get install libgfortran5 And in R: install.packages("RMark")

Regroup daily history for Rmark analysis

If you have daily CMR data, it can be too huge information for CMR analysis using Rmark. A solution is to group data by time period. Here is a solution without using any for loop. regrouphistory <- function(history, group=7) { if (any(sapply(history, nchar)!=nchar(history[1]))) stop("All histories must be of the same length") h1 <- strsplit(history, "") factor <- as.character(1:((length(h1[[1]]) %/% group)+1)) f <- as.character(sapply(factor, FUN=function(x) rep(x, group)))[seq_along(h1[[1]])] r <- sapply(h1, function(h) {h3 <- vapply(split(h, f), function(x) ifelse(any(x=="1"), "1", "0"), FUN.VALUE = "0") h3 <- h3[order(as.numeric(names(h3)))] return(paste0(h3, collapse = "")) }) return(r) } histoire <- "000000001000010100000100000100001000000000000" regrouphistory(histoire, group=10) [1] "11110" histoire <- c("0000000010000101000001000001000010

Install mark in MacOSX

brew tap sjbonner/tap brew install mark-on-mac Done !

ifelse() must be used with caution

The if else statement is very useful when you work with a vector, but take care, it must be used with caution because it can be very slow : Aini =  runif(1000000, min=-1,max=1) library(microbenchmark) A <- Aini microbenchmark({B1 <- ifelse( A < 0, sqrt(-A), A )}) # mean = 77.55551 A <- Aini microbenchmark({B2 <- ifelse( A < 0, suppressWarnings(sqrt(-A)), A )}) # mean = 76.53762 A <- Aini microbenchmark({B3 <- ifelse( A < 0, sqrt(abs(A)), A )}) # mean = 75.26712 A <- Aini microbenchmark({A[A < 0] <- sqrt(-A[A < 0]);B4 <- A}) # mean = 17.71883

Understanding glm

Let do a simple glm to explore exactly how it works: > datax <- data.frame(y=rnorm(100), x1=rnorm(100), +                     x2=rnorm(100), x3=rnorm(100), x4=rnorm(100),  +                     x5=sample(x=c("A", "B"), size=100, replace = TRUE)) > gnul <- glm(y ~ 1, data=datax) First, let see the number of fitted parameters : > length(gnul$coefficients) [1] 1 But when you use logLik(), two parameters are indicated as df=: > logLik(gnul) 'log Lik.' -153.8374 (df=2) If you do the glm "by hand", the number of fitted parameters is 2: > dnormx <- function(x, data) {-sum(dnorm(data, mean=x["mean"], sd=x["sd"], log = TRUE))} > parg <- c(mean=0, sd=1) > o0 <- optim(par = parg, fn=dnormx, data=datax[, "y"]) > o0$par       mean         sd  -0.1338348  1.1270446  > o0$value [1] 153.8374 Then first question: where the df=2 comes from? Let take a look at the logLik

AIC for mixed models: cAIC

Model selection was performed using the conditional Akaike information criterion (cAIC). This measure of the quality of fit penalised by the number of parameters corrected (Burnham and Anderson, 2002) was specially developed for mixed models (Greven and Kneib, 2010; Säfken et al., 2018 preprint). Greven S, Kneib T (2010) On the behaviour of marginal and conditional Akaike Information Criteria in linear mixed models. Biometrika 97: 773-789 Säfken B, Rügamer D, Kneib T, Greven S (2018) Conditional model selection in mixed-effects models with cAIC4. arXiv 1803.05664v2: 1-31 library(cAIC4) datax <- data.frame(y=rnorm(100), x1=rnorm(100),                     x2=rnorm(100), x3=rnorm(100), x4=rnorm(100), x5=sample(x=c("A", "B"), size=100, replace = TRUE)) g0 <- lmer(y ~ x1+x2+x3+x4 + (1 | x5), data=datax) cAIC(g0) cAIC(g0)$caic

clang in Macosx

By default, the clang version used is the one provided by Xcode (base) marcgirondot@MacBook-Air-de-Marc bin % clang --version Apple clang version 11.0.0 (clang-1100.0.33.12) Target: x86_64-apple-darwin19.0.0 Thread model: posix InstalledDir: /Applications/Xcode.app/Contents/Developer/Toolchains/XcodeDefault.xctoolchain/usr/bin If you install gcc using homebrew, you have another version: (base) marcgirondot@MacBook-Air-de-Marc bin % /usr/local/opt/llvm/bin/clang --version clang version 9.0.0 (tags/RELEASE_900/final) Target: x86_64-apple-darwin19.0.0 Thread model: posix InstalledDir: /usr/local/opt/llvm/bin The Xcode version of clang does not understand the option -fopenmp whereas the version of gcc understand this option. Then it can be important to know which version of clang you are using. You can define which clang version to be used in R session by setting: ~/.R/Makevars with # The following statements are required to use the clang bin

Permission error in install packages in Ubuntu

If you have errors like: permission denied, enter these commands cd /usr/lib/ sudo chmod -R a+w R cd /usr/share/ sudo chmod -R a+w R ______________________________________ If you have this error in Ubuntu 22.04 lib = "/usr/local/lib/R/site-library"' ne peut être ouvert en écriture Try: cd /usr/local/lib/R sudo chown -R root:staff site-library sudo chmod -R 02775 site-library

Catalina installation

After the installation of Catalina (MacOSX 10.15), I had several problems: - I was forced to accept that RStudio 1.3.572 had access to all the files of the computer; - I cannot compile; I had this message: fatal error: _stdio.h: No such file or directory  #include <_stdio.h> I try this xcode-select --install

tiff, png or jpg pictures

From an answer in r-help list: Question: Whether I use tiff, png, jpeg, or pdf I always see vertical and horizontal lines at every grid increment on the plots. Answer by colin@colinsmith.org : This problem comes from the way Quartz renders immediately adjacent filled polygons. To get around it, you can add type=“cairo” or type=“Xlib” as an argument to the tiff, png, or jpeg call.

° symbol and other unicode codes in knitr

To use ° symbol in knitr or sweave, first load the latex package gensymb  and after use this code $ \degree $. Then the beginning of your code should be something like that: \documentclass[a4paper]{article} \usepackage{gensymb} If the package gensymb is not present, alternative is to do: \documentclass[a4paper]{article} \DeclareTextSymbol{\degree}{OT1}{23} ############################################### To use the ° symbol within a chunk, you must define the encoding. Be sure also to save the .Rnw file using the same encoding (command File -> Save with encoding... in Rstudio). For latin1: \documentclass[a4paper]{article} \usepackage[latin1]{inputenc} \begin{document} <<>>= degree <- "°" print(degree) @ \end{document} For utf8 (based on a remark of  Yihui Xie in r-help list): If you use pdflatex, you have to declare the font encoding \usepackage[T1]{fontenc} when you save the document with UTF-8: \docum

How to deal with character(0)

Let x <- character(0) x == character(0) returns logical(0), which is not what we expect. A solution is to test: identical(x, character(0)) But it does not work if x has attributes. Then, do: attributes(x) <- NULL identical(x, character(0)) or  (length(x) == 0) && (typeof(x) == "character")

Convert Lat-Lon to UTM and reverse

Image
library(PBSmapping) utm <- structure(list(x = c(160915.9, 161253.9, 161253.9),  y = c(2573771, 2573763, 2573763)), .Names = c("x",  "y"), row.names = c(NA, -3L), class = "data.frame") datainUTM<-data.frame(cbind(utm$x/1000,                              utm$y/1000,                              rep(0, dim(utm)[1]),                              1:dim(utm)[1])) names(datainUTM)<-c("X", "Y", "PID", "POS") attr(datainUTM, "projection") <-"UTM" attr(datainUTM, "zone") <-18 datosLL<-convUL(datainUTM) > datosLL          X       Y PID POS 1 -78.3133 23.2383   0   1 2 -78.3100 23.2383   0   2 3 -78.3100 23.2383   0   3 Alternative library(sp) library(rgdal) orig <- data.frame(lat = c(23.2383,23.2383,23.2383),                     long = c(-78.3133,-78.3100,-78.3100),                     elv = c(4.01, 4.00, 4.00)) coordina

User Agent of any browser

http://www.useragentstring.com Can then be used in Rcurl: require(RCurl) require(XML) webpage <- getURLContent(" http://www.useragentstring.com ", useragent = "Mozilla/5.0 (Macintosh; Intel Mac OS X 10_9_1) AppleWebKit/537.73.11 (KHTML, like Gecko) Version/7.0.1 Safari/537.73.11")

strptime() with %p option in non-US locale

The option %p of the hour format for strptime() function requires that locale is set to US: > Sys.getlocale(category = "LC_TIME") [1] "fr_FR.UTF-8" > strptime("2004-01-17 12:49 AM", format="%Y-%m-%d %I:%M %p") [1] NA > Sys.setlocale(category = "LC_TIME", locale = "en_US.UTF-8" ) [1] "en_US.UTF-8" > strptime("2004-01-17 12:49 AM", format="%Y-%m-%d %I:%M %p") [1] "2004-01-17 00:49:00" If your system does not allow to use  "en_US.UTF-8", just indicate "C"

Gamma distribution parameters from mean and variance of data distribution

set.seed(31234) x <- rgamma(100, shape=2.0, rate=11.0) hist(x) #print(x) shape <- 2.0 rate <- 11.0 scale <- 1/rate m <- mean(x) print(shape * scale) print(shape * 1 / rate) v <- var(x) print(shape * scale^2) print(shape * (1 / rate) ^2) print(m) print(v) scale <- v/m shape <- m*m/v rate <- 1/scale print(shape) print(rate) library(fitdistrplus) fitdist(data=x, distr="gamma", method = "mle") fitdist(data=x, distr="gamma", method = "mme") Note that the gamma distribution cannot be fitted when standard deviation (and then variance) is null: scale <- v/m # is 0 shape <- m*m/v # is +Inf rate <- 1/scale # is +Inf And > x <- rep(100, 1000) > library(fitdistrplus) > fitdist(data=x, distr="gamma", method = "mle") <simpleError in optim(par = vstart, fn = fnobj, fix.arg = fix.arg, obs = data,     gr = gradient, ddistnam = ddistname, hessian = TRUE

Bug in R 3.6.1: When file.copy deletes your file !

A <- 10 save(A, file="A.Rdata") file.symlink(from="A.Rdata", to="B.Rdata") rm(A) load(file="B.Rdata") print(A) system("ls -l") file.copy(from="A.Rdata", to="B.Rdata", overwrite = TRUE) # A.Rdata becomes empty: 0B system("ls -l") # In terminal marcgirondot$ ls A.Rdata marcgirondot$ ln -s A.Rdata B.Rdata marcgirondot$ ls -l -rw-r--r--  1 marcgirondot  staff      70 13 sep 11:38 A.Rdata lrwxr-xr-x  1 marcgirondot  staff       7 13 sep 11:38 B.Rdata -> A.Rdata marcgirondot$ cp A.Rdata B.Rdata cp: B.Rdata and A.Rdata are identical (not copied).

Error in foreign and nlme packages installation

I just get some errors in the update of foreign and nlme packages (R 3.6.1): In both cases, I had this error: dyld: Library not loaded: /opt/local/lib/libcrypto.1.0.0.dylib   Referenced from: /opt/local/lib/libxar.1.dylib   Reason: image not found fatal error: otool: fatal error in /opt/local/bin/llvm-objdump-mp-7.0 dyld: Library not loaded: /opt/local/lib/libcrypto.1.0.0.dylib   Referenced from: /opt/local/lib/libxar.1.dylib   Reason: image not found fatal error: otool: fatal error in /opt/local/bin/llvm-objdump-mp-7.0 dyld: Library not loaded: /opt/local/lib/libcrypto.1.0.0.dylib   Referenced from: /opt/local/lib/libxar.1.dylib   Reason: image not found fatal error: otool: fatal error in /opt/local/bin/llvm-objdump-mp-7.0 dyld: Library not loaded: /opt/local/lib/libcrypto.1.0.0.dylib   Referenced from: /opt/local/lib/libxar.1.dylib   Reason: image not found fatal error: otool: fatal error in /opt/local/bin/llvm-objdump-mp-7.0 dyld: Library not loaded: /opt/local/li

Install R and Rstudio in Lubuntu 18.04

Installing R and Rstudio was not so easy in a fresh Lubuntu 18.04 install. Here is the solution : First open the terminal and enter: sudo apt update sudo apt upgrade Edit the file    /etc/apt/sources.list and add: deb https://cloud.r-project.org/bin/linux/ubuntu bionic-cran35/ Enter these commands also in terminal: sudo apt-key adv --keyserver keyserver.ubuntu.com --recv-keys E298A3A825C0D65DFD57CBB651716619E084DAB9 sudo apt update sudo apt upgrade sudo apt install r-base r-base-dev Load this file: https://download1.rstudio.org/desktop/bionic/amd64/rstudio-1.2.1335-amd64.deb (or any newer) And install it In terminal, enter: sudo apt install at-spi2-core sudo apt install build-essential sudo apt install qtcreator sudo apt install qt5-default Restart using: sudo reboot And run Rstudio with: export QT_XCB_FORCE_SOFTWARE_OPENGL=1 export QT_STYLE_OVERRIDE="" /usr/lib/rstudio/bin/rstudio it forces to not use the  xserver-xorg-v

Deviance test for binomial distribution

# Let A et B being observations from binomial distribution: A <- c(10, 10, 9, 7, 3, 2, 3) B <- c(2, 5, 6, 6, 10, 15, 20) # And the prediction of proportion being pred: pred <- c(0.9, 0.85, 0.75, 0.4, 0.3, 0.2, 0.1) # For example prod could be the result of a glm, or other model. # Number of parameters obtained from observations and used to estimate pred parameter <- 2 # Then the degrees of freedom are: df <- length(pred)-parameter LnL <- sum(dbinom(x=A, size = A+B,                    prob = pred, log = TRUE)) LnLSat <- sum(dbinom(x=A, size = A+B,                       prob = A/(A+B), log = TRUE)) deviance <- -2*(LnL - LnLSat) p <- 1-pchisq(deviance, df=df) # The larger is p, the more the observations could have been obtained from the model used to calculate pred # Do not use p<0.05 as a criteria; p is like a proxy plot(x=pred, y=A/(A+B), bty="n", las=1, xlim=c(0, 1), ylim=c(0,1)) text(x=0.8, y=0.

p-hacking: Another way to be sure to have significant results

Image
I discover recently the quantile regression: rather than doing a regression on your points, you are doing a regression on the quantile(probs) of your points. As you have an infinite possibility for probs, you can do an infinite number of p-values... be sure that you will find one significant ! Let try: df <- data.frame(y=runif(n = 10*20), x=rep(1:10, 20)) g0 <- glm(formula = y ~ x, data=df) k <- summary(g0) pvalue <- NULL for (probs in seq(from=0.01, to=0.99, by=0.01)) { q <- as.data.frame(aggregate(df, by=list(df$x), FUN = function(x) quantile(x, probs=probs))) g <- glm(formula = y ~ x, data=q) pvalue <- c(pvalue, summary(g)$coefficients["x", "Pr(>|t|)"]) } h <- hist(pvalue, breaks=seq(from=0, to=1, by=0.05), las=1) polygon(x=c(h$breaks[1], h$breaks[2], h$breaks[2], h$breaks[1]),         y=c(0, 0, h$counts[1], h$counts[1]),          col="grey") probs <- seq(from=0.01, to=0.99, by=0.01)[which.min(pvalue)]

Another R inferno: if () {} else {} + x

if (TRUE) { 0 } else { 2 } + 3 will return 0 and not 3 because the priority order is: if (TRUE) then {0} else {2} + 3 This is clearly counter-intuitive. As a general rule, I propose to never use result of a if statement directly in a computing. Note that ifelse() gives more normal result: ifelse(TRUE, 0, 2) + 3 will return 3

sample(x, length) or x[runif(length, 1:(length(x)+1))] : what is the most rapid?

microbenchmark(   sample(x = x, size=1000L, replace = TRUE) , sample(x = x, size=1000, replace = TRUE) , x[floor(runif(1000L, 1L, length(x)+1L))] , x[floor(runif(1000, 1, length(x)+1))] , x[runif(1000L, 1L, length(x)+1L)] , x[runif(1000, 1, length(x)+1)] , times = 10000L ) Unit: microseconds                                         expr    min      lq     mean  median      uq  sample(x = x, size = 1000L, replace = TRUE) 42.202 46.0750 51.70049 50.4445 53.1295   sample(x = x, size = 1000, replace = TRUE) 41.433 46.0935 51.52335 50.5570 53.0650   x[floor(runif(1000L, 1L, length(x) + 1L))] 40.027 42.2450 49.22916 49.5545 52.0355      x[floor(runif(1000, 1, length(x) + 1))] 40.112 42.1865 59.03723 49.5050 51.9370          x[runif(1000L, 1L, length(x) + 1L)] 37.124 39.2570 46.15197 46.4555 48.9570             x[runif(1000, 1, length(x) + 1)] 37.093 39.1935 54.89901 46.3630 48.7875 In conclusion, the most rapid is  x[runif(1000, 1, length(x) + 1)] But the

Integer, L, double, numeric

in R, integers can be setup using as.integer(x) or 1000L (L means L, long, because it used 32 bits representation of number which was longer than the old 8 or 16 bits !). f <- integer(length) creates a vector of size length with only 0. > f <- integer(1) > f [1] 0 > is.integer(f) [1] TRUE > identical(f, 0L) [1] TRUE The double() or numeric() are the same number representation: real() for R <3.0.0 was the same but is deprecated. microbenchmark(   1L:2000L   , 1:1000   , as.integer(1):as.integer(2000)   , times = 1000000L ) Unit: nanoseconds                            expr min  lq     mean median  uq      max                        1L:2000L 129 144 181.2866    147 153    64915                          1:1000 126 147 203.7078    149 154 20499610  as.integer(1):as.integer(2000) 299 329 453.9530    335 350 32912817

Bug in knitr / Rmarkdown for producing word document and graphics in pdf

Let try this minimal Rmarkdown file: --- title: "cex in Rmarkdown" output: word_document --- ```{r} knitr::opts_chunk$set(dev='pdf') ``` ```{r} plot((0:160)/4, 0:160, type="n") text(x=20, y=70, labels =expression(alpha), cex=1e-7) ``` When knitr-red from Rstudio (with r 3.6.1 on MacosX with knitr 1.24), it produced an error with this message ("Information of metric non available for this family") [translation from French because of my system configuration] However, text(x=20, y=70, labels =expression(alpha), cex=0) and text(x=20, y=70, labels =expression(alpha), cex=0.1) work. Also text(x=20, y=70, labels ="a", cex=1e-7) works but text(x=20, y=70, labels =expression("K"["0"]), cex=1e-7)   produced also an error. The error does not occur when dev='png' is used but it occurs also for dev='postscript'. The only solution that I found is something like that: cexindex <- The value that y