Articles

Affichage des articles du juillet, 2016

Plot on all the place of the window

Image
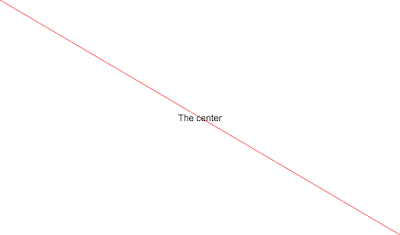
Let do a plot without any margin. The coordinates of the plot area are from 0 to 1 on both x and y axis. It can be changed with the xlim and ylim parameters. par(mar=c(0, 0, 0, 0)) plot(x=c(0, 1), y=c(0, 1), axes=FALSE,          xaxt="n", yaxt="n", main="",          xlab = "", ylab = "",          xaxs="i", yaxs="i", type="n") Here is an example on the use: lines(x=c(0, 1), y=c(1, 0), col="red") text(x = 0.5, y=0.5, pos=NULL, labels='The center')

Some examples of plotmath

Image
The plotmath expressions are never very easy to use. Here are some examples: plot(1:10, type="n", xaxt="n", yaxt="n", axes=FALSE, xlab="", ylab="") text(2, 8, expression(paste(bolditalic(p)^"*", '   expression(paste(bolditalic(p)^"*"))')), pos=4) text(2, 6, expression(paste(bolditalic(p)^textstyle("*"), '   expression(paste(bolditalic(p)^textstyle("*")))')), pos=4) text(2, 4, expression(paste(bolditalic(p)*"*", '   expression(paste(bolditalic(p)*"*"))')), pos=4)

Flush warnings() cache and convert warnings to error for debugging

Flush warnings assign("last.warning", NULL, envir = baseenv()) Convert warnings to error options(warn = 2)