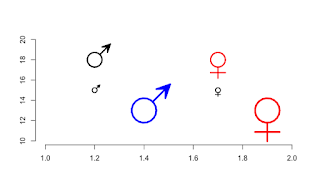
Elegant male and female symbols in R plot region
The trick shown here (http://max2.ese.u-psud.fr/epc/conservation/Girondot/Publications/Blog_r/Entrees/2013/10/22_Males_and_females_symbols.html) to draw males and females symbols produces ugly symbols.
Here are more elegant drawings if you need them in the plot region.
These two functions are included in the package HelpersMG.
symbol.Male <- function(centerx, centery, rayonx, lwd=2, col="black") {
xr <- ScalePreviousPlot()$xlim["range"]
yr <- ScalePreviousPlot()$ylim["range"]
ratio <- par("pin")[1]/par("pin")[2]
rayony <- rayonx*(yr/xr)*ratio
angle <- seq(from=0, to=2*pi, length.out = 20)
x <- centerx+rayonx*cos(angle)
y <- centery+rayony*sin(angle)
segments(x0=x, y0=y, x1=x[c(20, 1:19)], y1=y[c(20, 1:19)], col=col, lwd=lwd)
x0 = centerx+rayonx*sqrt(2)/2
y0 = centery+rayony*sqrt(2)/2
x1 = centerx+3*rayonx*sqrt(2)/2
y1 = centery+3*rayony*sqrt(2)/2
segments(x0=x0, y0=y0, x1=x1, y1=y1, col=col, lwd=lwd)
x11 <- centerx+2*rayonx*cos(2*pi*60/360)
y11 <- centery+2*rayony*sin(2*pi*60/360)
x12 <- centerx+2.5*rayonx*cos(2*pi*45/360)
y12 <- centery+2.5*rayony*sin(2*pi*45/360)
x13 <- centerx+2*rayonx*cos(2*pi*30/360)
y13 <- centery+2*rayony*sin(2*pi*30/360)
x <- c(x1, x11, x12, x13, x1)
y <- c(y1, y11, y12, y13, y1)
polygon(x, y, col=col, lwd=lwd, border=col)
}
symbol.Female <- function(centerx, centery, rayonx, lwd=2, col="black") {
xr <- ScalePreviousPlot()$xlim["range"]
yr <- ScalePreviousPlot()$ylim["range"]
ratio <- par("pin")[1]/par("pin")[2]
rayony <- rayonx*(yr/xr)*ratio
angle <- seq(from=0, to=2*pi, length.out = 20)
x <- centerx+rayonx*cos(angle)
y <- centery+rayony*sin(angle)
segments(x0=x, y0=y, x1=x[c(20, 1:19)], y1=y[c(20, 1:19)], col=col, lwd=lwd)
segments(x0=centerx, y0=centery-rayony, x1=centerx, y1=centery-2.5*rayony, col=col, lwd=lwd)
segments(x0=centerx-rayonx, y0=centery-rayony-(2.5*rayony-rayony)/2,
x1=centerx+rayonx, y1=centery-rayony-(2.5*rayony-rayony)/2, col=col, lwd=lwd)
}
library(HelpersMG)
plot(x=1:2, y=c(10,20), type="n", bty="n", xlab="", ylab="")
rayonx <- 0.01
centerx <- 1.2
centery <- 15
symbol.Male(centerx=centerx, centery = centery, rayonx=rayonx)
symbol.Female(centerx=centerx+0.5, centery = centery, rayonx=rayonx)
rayonx <- 0.03
centerx <- 1.2
centery <- 18
symbol.Male(centerx=centerx, centery = centery, rayonx=rayonx, lwd=3)
symbol.Female(centerx=centerx+0.5, centery = centery, rayonx=rayonx, lwd=3, col="red")
rayonx <- 0.05
centerx <- 1.4
centery <- 13
symbol.Male(centerx=centerx, centery = centery, rayonx=rayonx, lwd=4, col="blue")
symbol.Female(centerx=centerx+0.5, centery = centery, rayonx=rayonx, lwd=4, col="red")
Note also this solution using unicode, but I prefer my symbols!
#plot female (unicode 2640) and male (unicode 2642) symbols
text(1.4,18,"\u2640",cex=5)
text(1.6,18,"\u2642",cex=5)
Here are more elegant drawings if you need them in the plot region.
These two functions are included in the package HelpersMG.
symbol.Male <- function(centerx, centery, rayonx, lwd=2, col="black") {
xr <- ScalePreviousPlot()$xlim["range"]
yr <- ScalePreviousPlot()$ylim["range"]
ratio <- par("pin")[1]/par("pin")[2]
rayony <- rayonx*(yr/xr)*ratio
angle <- seq(from=0, to=2*pi, length.out = 20)
x <- centerx+rayonx*cos(angle)
y <- centery+rayony*sin(angle)
segments(x0=x, y0=y, x1=x[c(20, 1:19)], y1=y[c(20, 1:19)], col=col, lwd=lwd)
x0 = centerx+rayonx*sqrt(2)/2
y0 = centery+rayony*sqrt(2)/2
x1 = centerx+3*rayonx*sqrt(2)/2
y1 = centery+3*rayony*sqrt(2)/2
segments(x0=x0, y0=y0, x1=x1, y1=y1, col=col, lwd=lwd)
x11 <- centerx+2*rayonx*cos(2*pi*60/360)
y11 <- centery+2*rayony*sin(2*pi*60/360)
x12 <- centerx+2.5*rayonx*cos(2*pi*45/360)
y12 <- centery+2.5*rayony*sin(2*pi*45/360)
x13 <- centerx+2*rayonx*cos(2*pi*30/360)
y13 <- centery+2*rayony*sin(2*pi*30/360)
x <- c(x1, x11, x12, x13, x1)
y <- c(y1, y11, y12, y13, y1)
polygon(x, y, col=col, lwd=lwd, border=col)
}
symbol.Female <- function(centerx, centery, rayonx, lwd=2, col="black") {
xr <- ScalePreviousPlot()$xlim["range"]
yr <- ScalePreviousPlot()$ylim["range"]
ratio <- par("pin")[1]/par("pin")[2]
rayony <- rayonx*(yr/xr)*ratio
angle <- seq(from=0, to=2*pi, length.out = 20)
x <- centerx+rayonx*cos(angle)
y <- centery+rayony*sin(angle)
segments(x0=x, y0=y, x1=x[c(20, 1:19)], y1=y[c(20, 1:19)], col=col, lwd=lwd)
segments(x0=centerx, y0=centery-rayony, x1=centerx, y1=centery-2.5*rayony, col=col, lwd=lwd)
segments(x0=centerx-rayonx, y0=centery-rayony-(2.5*rayony-rayony)/2,
x1=centerx+rayonx, y1=centery-rayony-(2.5*rayony-rayony)/2, col=col, lwd=lwd)
}
library(HelpersMG)
rayonx <- 0.01
centerx <- 1.2
centery <- 15
symbol.Male(centerx=centerx, centery = centery, rayonx=rayonx)
symbol.Female(centerx=centerx+0.5, centery = centery, rayonx=rayonx)
rayonx <- 0.03
centerx <- 1.2
centery <- 18
symbol.Male(centerx=centerx, centery = centery, rayonx=rayonx, lwd=3)
symbol.Female(centerx=centerx+0.5, centery = centery, rayonx=rayonx, lwd=3, col="red")
rayonx <- 0.05
centerx <- 1.4
centery <- 13
symbol.Male(centerx=centerx, centery = centery, rayonx=rayonx, lwd=4, col="blue")
symbol.Female(centerx=centerx+0.5, centery = centery, rayonx=rayonx, lwd=4, col="red")

Note also this solution using unicode, but I prefer my symbols!
#plot female (unicode 2640) and male (unicode 2642) symbols
text(1.4,18,"\u2640",cex=5)
text(1.6,18,"\u2642",cex=5)
Commentaires
Enregistrer un commentaire