On the distribution of the maximum
It is very tempting as a biologist (being an human) to claim that we have found the "biggest" of something. A typical exemple can be seen here:
Fretey, J., A. H. Nibam, and D. Ngnamaloba. 2016. A new clutch size record from an olive ridley sea turtle nest in Cameroon. African Sea Turtle Newsletter 6:15-16.
But as statistician, what can we say about the "maximum" ?
Not many things because the maximum and minimum are the least robust statistics. It means that these statistics are very sensitive to the hypotheses.
To come back to the egg distribution, let do some simple modeling:
If egg number is distributed as a Gaussian distribution of average 100 and standard deviation 20, what is the distribution of the maximum, dependent on the number of clutches surveyed?
Note that there a an error in the table 1 because an average of 167.0 eggs for 50 nests is indicated in Guyana from Marquez (1980). If the average is 167, many nests should exhibit higher eggs number than 178 because SD is generally large! However I don't find the original source for these data from Guyana.
Note that there a an error in the table 1 because an average of 167.0 eggs for 50 nests is indicated in Guyana from Marquez (1980). If the average is 167, many nests should exhibit higher eggs number than 178 because SD is generally large! However I don't find the original source for these data from Guyana.
It is relatively simple to model. We will model also the distribution of the average.
resultat.max.mean <- rep(NA, 10)
resultat.max.sd <- rep(NA, 10)
resultat.mean.mean <- rep(NA, 10)
resultat.mean.sd <- rep(NA, 10)
for (indice.nb_clutch in 1:10) {
nb_clutch <- seq(from=10, to=100, by=10)[indice.nb_clutch]
maxobs <- rep(NA, 10000)
meanobs <- rep(NA, 10000)
for (replicates in 1:10000) {
obs <- rnorm(nb_clutch, mean=100, sd=20)
maxobs[replicates] <- max(obs)
meanobs[replicates] <- mean(obs)
}
resultat.max.mean[indice.nb_clutch] <- mean(maxobs)
resultat.max.sd[indice.nb_clutch] <- sd(maxobs)
resultat.mean.mean[indice.nb_clutch] <- mean(meanobs)
resultat.mean.sd[indice.nb_clutch] <- sd(meanobs)
}
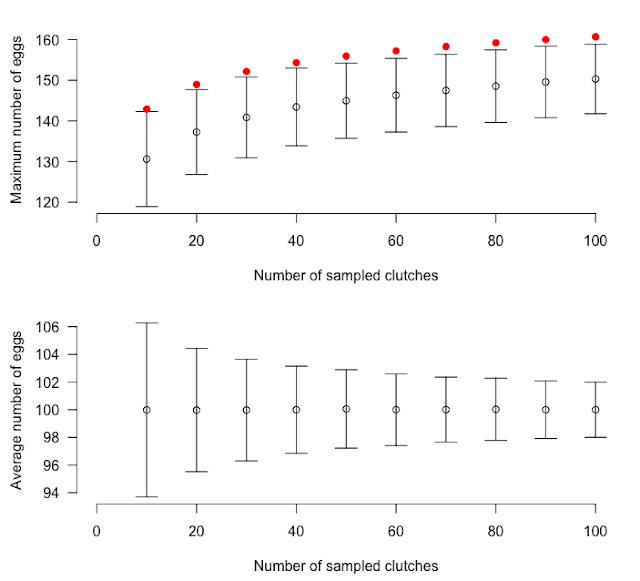
What we observe is exactly what was expected. The more you sampled clutches and the higher is the observed maximum (top graph); note that this effect is not observed for the mean which is a more robust statistics (bottom graph). The bars show two standard deviations. The red point shows the upper limit of the expected value for the maximum based on:
Dasarathy, G. 2011. A simple probability trick for bounding the expected maximum of n random variables. Unpublished work. hhttp://www.public.asu.edu/~gdasarat/files/maxGaussians.pdf

The code to plot the graphs is:
library(HelpersMG)
layout(mat=1:2)
par(mar=c(4, 4, 1, 1)+0.4)
plot_errbar(x=seq(from=10, to=100, by=10), y=resultat.max.mean,
errbar.y = resultat.max.sd,
ylab="Maximum number of eggs",
xlab="Number of sampled clutches",
bty="n", las=1, xlim=c(0, 100))
points(x = seq(from=10, to=100, by=10),
y=100+20*sqrt(2*log(seq(from=10, to=100, by=10))), col="red", pch=19)
plot_errbar(x=seq(from=10, to=100, by=10), y=resultat.mean.mean,
errbar.y = resultat.mean.sd,
ylab="Average number of eggs",
xlab="Number of sampled clutches",
bty="n", las=1, xlim=c(0, 100))
However, the maximum can have an interest if it has a genetic basis and could serve as a basis for selection.
Commentaires
Enregistrer un commentaire