Articles

Affichage des articles du avril, 2017

Get the coordinates of Volcanos from Wikipedia page

Image
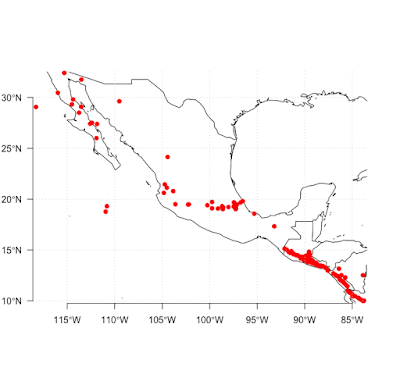
You can find many information in Wikipedia pages but sometimes in can be long to gather them manually. R can be used as a sucker of information. Let see how it can retrieve the coordinates of volcanos in Central America. The web pages are here: https://en.wikipedia.org/wiki/List_of_volcanoes_in_Mexico https://en.wikipedia.org/wiki/List_of_volcanoes_in_Guatemala https://en.wikipedia.org/wiki/List_of_volcanoes_in_El_Salvador https://en.wikipedia.org/wiki/List_of_volcanoes_in_Nicaragua https://en.wikipedia.org/wiki/List_of_volcanoes_in_Costa_Rica library(maps) library(mapdata) library(maptools) library(XML) # Note a problem in readHTMLTable. It cannot be used directly with url: # readHTMLTable(url, header=FALSE, stringsAsFactors = FALSE) generates an error # load a file in temporary directory url <- "https://en.wikipedia.org/wiki/List_of_volcanoes_in_Mexico" dest <- paste(tempdir(), "/List_of_volcanoes_in_Mexico.html", sep="")

Credibility interval at x% when the points do not fit an ellipse

Image
Imagine a logistic model with these data: t <- c(25, 25, 26, 28, 30, 32, 33, 33, 34) n <- c(10, 12, 13, 15, 10, 16, 10, 12, 15) x <- c(10, 12, 13, 15, 0, 0, 0, 0, 0) S <- -0.5 P <- 29 Lbinom <- function(data, x) -sum(dbinom(x=data$x, size=data$size, prob=1/(1+exp((1/x["S"])*(x["P"]-data$t))), log=TRUE)) Lbinom(data=list(x=x, size=n, t=t), x=c(P=P, S=S)) library("HelpersMG") parameters_mcmc <- data.frame(Density=c('dunif', 'dunif'),              Prior1=c(25, -2), Prior2=c(32, 2), SDProp=c(0.35, 0.2),              Min=c(25, -2), Max=c(32, 2), Init=c(29, -0.5), stringsAsFactors = FALSE,              row.names=c('P', 'S')) mcmc_run <- MHalgoGen(n.iter=50000, parameters=parameters_mcmc, data=list(x=x, size=n, t=t),                        likelihood=Lbinom, n.chains=1, n.adapt=100, thin=1, trace=1, adaptive = TRUE) plot(mcmc_run, parameters = 1, xlim=c(20, 35)) plot(mcmc_run, paramet

Different ways to show confidence interval as an ellipse or a minimum convex polygon, with gradient of colors

Image
Let calculate of sample of 100000 points defining credibility interval from MCMC with Metropolis-Hasting algorithm based on a logistic model: t <- c(25, 25, 26, 28, 30, 32, 33, 33, 34) n <- c(10, 12, 13, 15, 10, 16, 10, 12, 15) x <- c(10, 11, 12, 13, 5, 3, 1, 0, 0) S <- -0.5 P <- 29 Lbinom <- function(data, x) -sum(dbinom(x=data$x, size=data$size, prob=1/(1+exp((1/x["S"])*(x["P"]-data$t))), log=TRUE)) Lbinom(data=list(x=x, size=n, t=t), x=c(P=P, S=S)) library("HelpersMG") parameters_mcmc <- data.frame(Density=c('dunif', 'dunif'),              Prior1=c(25, -2), Prior2=c(32, 2), SDProp=c(0.35, 0.2),              Min=c(25, -2), Max=c(32, 2), Init=c(29, -0.5), stringsAsFactors = FALSE,              row.names=c('P', 'S')) mcmc_run <- MHalgoGen(n.iter=50000, parameters=parameters_mcmc, data=list(x=x, size=n, t=t),                        likelihood=Lbinom, n.chains=1, n.adapt=100, thin=1

Install rgeos package in MacOSX

First you must install gdal library: Load  GDAL Complete  at this link. Use the two installers present in that folder. Then enter in terminal: # this is optional if you have done it already. Check with # cat  ~/.profile sudo echo  'export PATH=/Library/Frameworks/GDAL.framework/Programs:$PATH' >> ~/.profile export PATH=/Library/Frameworks/GDAL.framework/Programs:$PATH cd ~/Downloads/ curl -O   https://cran.r-project.org/src/contrib/rgeos_0.3-23.tar.gz R CMD INSTALL  ~/Downloads/ rgeos_0.3-23.tar.gz --configure-args='--with-geos-config=/Library/Frameworks/GEOS.framework/unix/bin/geos-config'