Articles

Affichage des articles du mars, 2017

Loto: long term datasets

Image
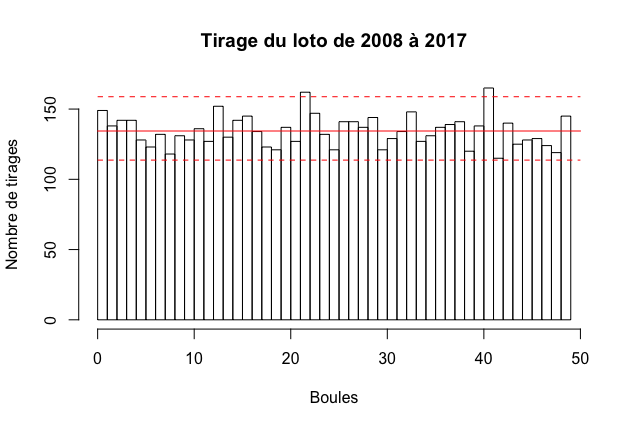
Load the historical data at  Historique LOTO®(entre octobre 2008 et mars 2017)Format Zip (69Ko) path <- "nouveau_loto.csv" historique <- read.csv2(file=path, header=TRUE, stringsAsFactors=FALSE) range(c(historique$boule_1, historique$boule_2, historique$boule_3,         historique$boule_4, historique$boule_5)) hist(c(historique$boule_1, historique$boule_2, historique$boule_3,        historique$boule_4, historique$boule_5), breaks = 0:49,      xlab="Boules", ylab="Nombre de tirages", main="Tirage du loto de 2008 à 2017") length(c(historique$boule_1, historique$boule_2, historique$boule_3,          historique$boule_4, historique$boule_5))/(49-1+1) limites <- getFromNamespace(".BinomialConfidence", ns="HelpersMG")(length(c(historique$boule_1, historique$boule_2, historique$boule_3,                                                                  historique$boule_4, historique$boule_5))/(49-1+1), length(c

Comment manipuler l'information: exemple de la production industrielle

Image
Generally I write this blog in English, but exceptionally it it in French because the subject is directly linked with French Presidential election 2017. Dans le débat du 20 mars 2017, Marine Le Pen a montré un graphique assez impressionnant montrant  (ou semblant montrer !) que "quelque chose s'est passé lors du passage à l'Euro, en 2000". Voici le graphique en question: Il s'agit d'une superbe manipulation des données qui est basée sur la standardisation des données sur une année particulière. Vous aurez l'impression qu'il s'est passé quelque chose de particulier cette année. Voyons comment le faire sous R. D'abord il faut récupérer les données de production industrielle auprès de l'OCDE: https://data.oecd.org/fr/industry/production-industrielle.htm Choisissez la période 1974-2016. Le fichier téléchargé en .csv s'appelle pour moi : DP_LIVE_21032017190715494.csv Voici le script pour le lire: > prodIndus <- read.csv(

Install RnetCDF package in MacOSX (update without macports)

1- install Xcode from app store (take care, it is 4 GB !) 2- Open Xcode from application folder and install line command tools 3- Open terminal and enter:  sudo xcodebuild -license 4- Go to the end and enter agree Install Homebrew:  https://brew.sh/index_fr brew install netcdf If you obtain an error, try:  brew link --overwrite netcdf brew install hdf5 brew install udunits cd ~/Downloads/ curl -O https://cran.r-project.org/src/contrib/RNetCDF_2.4-2.tar.gz export DYLD_LIBRARY_PATH=/usr/local/lib:$DYLD_LIBRARY_PATH R CMD INSTALL --configure-args="CPPFLAGS=-I/usr/local/include LDFLAGS=-L/usr/local/lib LIBS=-lhdf5" RNetCDF_2.4-2.tar.gz

Install rgdal package in MacOSX

(Update 21/5/2021) brew install gdal (Updated 28/7/2017 - It works with R-devel 3.5) First you must install gdal library: Load GDAL Complete at this link. Use the gdal installers present in that folder. Then enter in terminal: sudo echo  'export PATH=/Library/Frameworks/GDAL.framework/Programs:$PATH' >> ~/.profile export PATH=/Library/Frameworks/GDAL.framework/Programs:$PATH cd ~/Downloads/ curl -O http://download.osgeo.org/proj/proj-4.9.3.tar.gz curl -O https://cran.r-project.org/src/contrib/rgdal_1.2-16.tar.gz tar -xzvf proj-4.9.3.tar.gz cd proj-4.9.3 ./configure make && make test sudo make install cd ~/Downloads/ sudo R CMD INSTALL –configure-args='-–with-proj-include=/usr/local/lib' rgdal_1.2-16.tar.gz