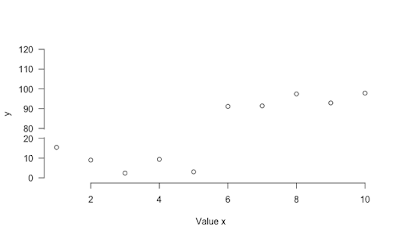
plot with broken y-axis
Here is a function to implement broken y-axis.
Several enhancements could be done to make it nicer but it works. However it was not fully tested.
plot.break <- function(x, y, at.cut, at.continue, add.cut,
number.ticks.bottom, number.ticks.up,
min.y, max.y, ...) {
p.plot <- list(...)
p.plot <- modifyList(list(x = x, y=ifelse(y>at.cut, y-at.continue+add.cut, y),
bty="n", type="p", las=1,
ylim=c(min.y, max.y-at.continue+add.cut),
yaxt="n", xlab="x", ylab="y"),
p.plot)
do.call(plot, p.plot)
y.axis <- c(seq(from=0, to=at.cut, length=number.ticks.bottom),
seq(from=at.cut+add.cut, to=ScalePreviousPlot()$ylim[2],
length=number.ticks.up))
axis(2, at=y.axis,
labels=ifelse(y.axis>at.cut, y.axis+at.continue-add.cut, y.axis),
las=1)
par(xpd=TRUE)
x.left <- ScalePreviousPlot()$xlim[1]-0.05*ScalePreviousPlot()$xlim["range"]
x.right <- ScalePreviousPlot()$xlim[1]+0.00*ScalePreviousPlot()$xlim["range"]
polygon(x=c(x.left, x.right, x.right, x.left, x.left),
y=c(at.cut+0.5, at.cut+0.5, at.cut+add.cut-0.5,
at.cut+add.cut-0.5, at.cut+0.5),
col="white", border=NA)
}
x <- 1:10
y <- c(rnorm(5, 10, 5), rnorm(5, 100, 5))
library(HelpersMG)
at.cut <- 20
at.continue <- 60
add.cut <- 5
number.ticks.bottom <- 3
number.ticks.up <- 5
min.y <- 0
max.y <- 120
plot.break(x = x, y=y, at.cut= 20,
at.continue= 60,
add.cut= 5,
number.ticks.bottom= 3,
number.ticks.up= 5,
min.y= 0,
max.y= 120, xlab="Value x")

Commentaires
Enregistrer un commentaire