Manipulate ncdf files
library("HelpersMG")
# Guatemala map
# get the ncdf file here for 2010, 2011, 2012
# <a href="http://www.esrl.noaa.gov/psd/cgi-bin/db_search/DBListFiles.pl?did=132&tid=33865&vid=2423">http://www.esrl.noaa.gov/psd/cgi-bin/db_search/DBListFiles.pl?did=132&tid=33865&vid=2423</a>
# ftp://ftp.cdc.noaa.gov/Datasets/noaa.oisst.v2.highres/sst.day.mean.2012.v2.nc
# ftp://ftp.cdc.noaa.gov/Datasets/noaa.oisst.v2.highres/sst.day.mean.2011.v2.nc
# ftp://ftp.cdc.noaa.gov/Datasets/noaa.oisst.v2.highres/sst.day.mean.2010.v2.nc
url <- "ftp://ftp.cdc.noaa.gov/Datasets/noaa.oisst.v2.highres/sst.day.mean.2012.v2.nc"
dest <- paste(Sys.getenv("HOME"), "/sst.day.mean.2012.v2.nc", sep="")
download.file(url, dest)
url <- "ftp://ftp.cdc.noaa.gov/Datasets/noaa.oisst.v2.highres/sst.day.mean.2011.v2.nc"
dest <- paste(Sys.getenv("HOME"), "/sst.day.mean.2011.v2.nc", sep="")
download.file(url, dest)
url <- "ftp://ftp.cdc.noaa.gov/Datasets/noaa.oisst.v2.highres/sst.day.mean.2010.v2.nc"
dest <- paste(Sys.getenv("HOME"), "/sst.day.mean.2010.v2.nc", sep="")
download.file(url, dest)
library("ncdf4")
dta2010<-nc_open(paste(Sys.getenv("HOME"), "/sst.day.mean.2010.v2.nc", sep=""))
dta2011<-nc_open(paste(Sys.getenv("HOME"), "/sst.day.mean.2011.v2.nc", sep=""))
dta2012<-nc_open(paste(Sys.getenv("HOME"), "/sst.day.mean.2012.v2.nc", sep=""))
# get the daily sst temperature for Pacific Guatemala
indice <- ind_long_lat(ncdf=dta2010, long=-90.25, lat=13.5)
Monterrico2010<-ncvar_get(dta2010, varid="sst", start=c(indice,1), count=c(1, 1, dta2010$dim$time$len))
Monterrico2011<-ncvar_get(dta2011, varid="sst", start=c(indice,1), count=c(1, 1, dta2011$dim$time$len))
Monterrico2012<-ncvar_get(dta2012, varid="sst", start=c(indice,1), count=c(1, 1, dta2012$dim$time$len))
# 366 because 2012 is bisextille year
Monterrico2012<-c(Monterrico2012, rep(NA, 366-length(Monterrico2012)))
Monterrico<-c(Monterrico2010, Monterrico2011, Monterrico2012)
names(Monterrico)<-seq(from=as.Date("2010-01-01"), by="1 days", length.out=length(Monterrico))
# plot the SST temperatures
plot(as.Date(names(Monterrico)), Monterrico, xlab="Days", ylab="SST C", type="l", bty="n", axes=FALSE)
axis(side = 1, at = seq(from=as.Date("2010-01-01"), by="1 month",
length.out=length(Monterrico)),
labels=c(labels=rep(c("J", "F", "M", "A", "M", "J", "J", "A", "S", "O", "N", "D"),
round(length(Monterrico)/365.25)+1), ((round(length(Monterrico)/365.25)+1)*12+1):(length(Monterrico))))
axis(side=2)
library("fields")
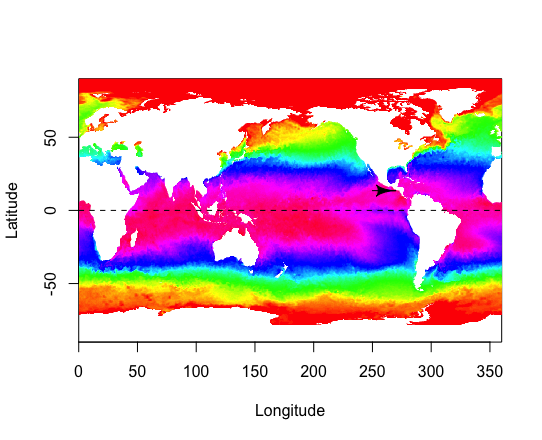
# Map centered to Pacific
day <- as.Date("2010-02-01")
carte<-ncvar_get(dta2010, varid="sst", start=c(1,1,as.numeric(day-as.Date("2010-01-01")+1)), count=c(dta2010$dim$lon$len, dta2010$dim$lat$len, 1))
image(dta2010$dim$lon$vals, dta2010$dim$lat$vals, carte, col=rainbow(128), xlab="Longitude", ylab="Latitude");segments(0,0,360,0, lwd=1, lty=2)
# Arrow to Guatemala
HelpersMG:::.Arrows(x1=-110%%360, 5, x0=-90.25%%360, y0=13.5, y1=13.5)


Commentaires
Enregistrer un commentaire