Credible interval for median of Weibull distribution
Alternative proposed by Varin Sacha using the package weibulltools with delta method (a little bit modified to present only the median and the CI):
> 2*log(2)^(1/2)
[1] 1.665109
Let try if the average estimate by Fisher method for 1,000 samples is biased or not:
Distribution of median of Weibull using Bayesian MCMC
Marc Girondot
15 février 2022
Download & install packages
if(!require("HelpersMG")){
# This first install install the dependencies
install.packages("HelpersMG")
# This second install update the package to its last version
install.packages("http://max2.ese.u-psud.fr/epc/conservation/CRAN/HelpersMG.tar.gz", repos=NULL, type="source")
suppressPackageStartupMessages(require("HelpersMG"))
}
library(HelpersMG)
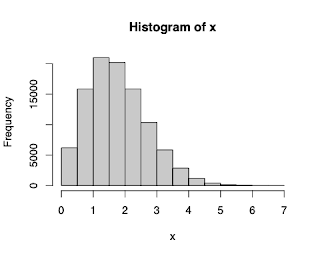
Generate data
x <- rweibull(100000,2,2)
Plot observations
hist(x)
The likelihood function of Weibull distribution
lnW <- function(par, data) {
L <- -sum(dweibull(x=data, shape=par["shape"], scale = par["scale"], log = TRUE))
return(L)
}
Fit distribution of scale and shape using MCMC
par <- c(shape=2, scale=2)
priors <- data.frame(Density=rep("dunif", length(par)),
Prior1=c(0, 0),
Prior2=c(5, 5),
SDProp=c(0.001, 0.001),
Min=c(0, 0),
Max=c(5, 5),
Init=par, stringsAsFactors = FALSE)
rownames(priors)<- names(par)
out_MCMC <- MHalgoGen(likelihood = lnW, parameters=priors,
data=x, parameters_name = "par", trace=100,
n.adapt = 10, n.iter = 10000, thin=20,
adaptive = TRUE)
## Chain 1: [1] -128801.497439969
## Chain 1: [10001] -128801.910532539
## -128801.178434339: Best likelihood for:
## c('shape' = 1.9995471453286606,
## 'scale' = 1.997342902775386)
Distribution of posteriors scale and shape
plot(out_MCMC, parameters="scale")

plot(out_MCMC, parameters="shape")

Posterior predictive median
median_posterior <- apply(out_MCMC$resultMCMC[[1]], MARGIN = 1, function(r) r["scale"]*log(2)^(1/r["shape"]))
quantile(median_posterior, probs=c(0.025, 0.5, 0.975))
## 2.5% 50% 97.5%
## 1.656699 1.663038 1.668994
Commentaires
Enregistrer un commentaire