Distribution of Pearson coefficient of correlation
library(hypergeo)
pearson.p <- function(r, n, rho=0) {
# n # Number of observations
# r # Valeur for which density needs to be estimated
# rho # Observed correlation
N <- (n-2)*gamma(n-1)*(1-rho^2)^((n-1)/2)*(1-r^2)^((n-4)/2)
D <- sqrt(2*pi)*gamma(n-1/2)*(1-rho*r)^(n-3/2)
P <- hypergeo(A=1/2, B=1/2, C=(2*n-1)/2, z=(rho*r+1)/2)
return((N/D)*P)
}
# When the correlation is null, it simplified to :
pearson.p.0 <- function(r, n) {
pofr <- ((1-r^2)^((n-4)/2))/beta(a = 1/2, b = (n-2)/2)
return(pofr)
}
n <- 50
# Generate 1000 series of n random variables
m <- sapply(X = 1:1000, FUN = function(x) rnorm(n))
# Calculate the pearson correlation between all the series (1000x1000)
cors <- cor(x = m, method = "pearson")
# take only the off-diagonals, otherwise there'd be duplicates
cor.data <- cors[upper.tri(cors, diag = FALSE)]
par(mar=c(4, 4, 1, 1)+0.4)
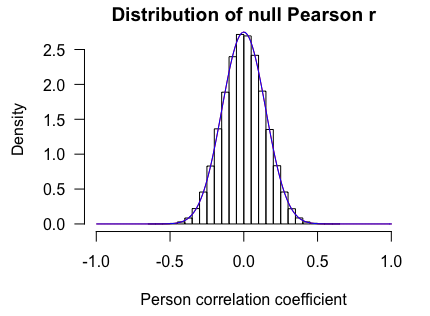
hist(cor.data, xlim=c(-1, 1), freq=FALSE,
las=1, main="Distribution of null Pearson r", xlab="Person correlation coefficient")
par(xpd=TRUE)
lines(x=seq(from=-1, to=1, by=0.01),
y=pearson.p(r=seq(from=-1, to=1, by=0.01), n=n, rho=mean(cor.data)),
col="red"
)
par(xpd=TRUE)
lines(x=seq(from=-1, to=1, by=0.01),
y=pearson.p.0(r=seq(from=-1, to=1, by=0.01), n=n),
col="blue"
)

n <- 50
# Generate 1000 series of n random variables with positive correlation
m <- sapply(X = 1:1000, FUN = function(x) rnorm(n))
m[50, ] <- m[50, 1]
m[49, ] <- m[49, 1]
m[48, ] <- m[48, 1]
m[47, ] <- m[47, 1]
m[46, ] <- m[46, 1]
m[45, ] <- m[45, 1]
# Calculate the pearson correlation between all the series (1000x1000)
cors <- cor(x = m, method = "pearson")
# take only the off-diagonals, otherwise there'd be duplicates
cor.data <- cors[upper.tri(cors, diag = FALSE)]
par(mar=c(4, 4, 1, 1)+0.4)
hist(cor.data, xlim=c(-1, 1), freq=FALSE,
las=1, main="Distribution of Pearson r", xlab="Person correlation coefficient")
par(xpd=TRUE)
lines(x=seq(from=-1, to=1, by=0.01),
y=pearson.p(r=seq(from=-1, to=1, by=0.01), n=n, rho=mean(cor.data)),
col="red"
)
pearson.p <- function(r, n, rho=0) {
# n # Number of observations
# r # Valeur for which density needs to be estimated
# rho # Observed correlation
N <- (n-2)*gamma(n-1)*(1-rho^2)^((n-1)/2)*(1-r^2)^((n-4)/2)
D <- sqrt(2*pi)*gamma(n-1/2)*(1-rho*r)^(n-3/2)
P <- hypergeo(A=1/2, B=1/2, C=(2*n-1)/2, z=(rho*r+1)/2)
return((N/D)*P)
}
# When the correlation is null, it simplified to :
pearson.p.0 <- function(r, n) {
pofr <- ((1-r^2)^((n-4)/2))/beta(a = 1/2, b = (n-2)/2)
return(pofr)
}
n <- 50
# Generate 1000 series of n random variables
m <- sapply(X = 1:1000, FUN = function(x) rnorm(n))
# Calculate the pearson correlation between all the series (1000x1000)
cors <- cor(x = m, method = "pearson")
# take only the off-diagonals, otherwise there'd be duplicates
cor.data <- cors[upper.tri(cors, diag = FALSE)]
par(mar=c(4, 4, 1, 1)+0.4)
hist(cor.data, xlim=c(-1, 1), freq=FALSE,
las=1, main="Distribution of null Pearson r", xlab="Person correlation coefficient")
par(xpd=TRUE)
lines(x=seq(from=-1, to=1, by=0.01),
y=pearson.p(r=seq(from=-1, to=1, by=0.01), n=n, rho=mean(cor.data)),
col="red"
)
par(xpd=TRUE)
lines(x=seq(from=-1, to=1, by=0.01),
y=pearson.p.0(r=seq(from=-1, to=1, by=0.01), n=n),
col="blue"
)
n <- 50
# Generate 1000 series of n random variables with positive correlation
m <- sapply(X = 1:1000, FUN = function(x) rnorm(n))
m[50, ] <- m[50, 1]
m[49, ] <- m[49, 1]
m[48, ] <- m[48, 1]
m[47, ] <- m[47, 1]
m[46, ] <- m[46, 1]
m[45, ] <- m[45, 1]
# Calculate the pearson correlation between all the series (1000x1000)
cors <- cor(x = m, method = "pearson")
# take only the off-diagonals, otherwise there'd be duplicates
cor.data <- cors[upper.tri(cors, diag = FALSE)]
par(mar=c(4, 4, 1, 1)+0.4)
hist(cor.data, xlim=c(-1, 1), freq=FALSE,
las=1, main="Distribution of Pearson r", xlab="Person correlation coefficient")
par(xpd=TRUE)
lines(x=seq(from=-1, to=1, by=0.01),
y=pearson.p(r=seq(from=-1, to=1, by=0.01), n=n, rho=mean(cor.data)),
col="red"
)

Commentaires
Enregistrer un commentaire