Bivariate confidence interval as a bubble (irregular ellipse)
This function will be useful if you want show the confidence interval of bivariate plots as a bubble (an irregular ellipse).
Note that this function has been introduced and enhanced in my package HelpersMG available in CRAN
ellipse <- function(center.x = 0, center.y = 0,
radius.x = 1, radius.y = 1,
radius.x.lower=NULL, radius.x.upper=NULL,
radius.y.lower=NULL, radius.y.upper=NULL, col=rgb(0, 0, 0, 0.1)) {
if (is.null(radius.x.lower)) radius.x.lower <- radius.x
if (is.null(radius.y.lower)) radius.y.lower <- radius.y
if (is.null(radius.x.upper)) radius.x.upper <- radius.x
if (is.null(radius.y.upper)) radius.y.upper <- radius.y
for (k in seq_along(center.x)) {
theta <- seq(0, pi / 2, length=100)
x <- center.x[k] + radius.x.upper[k] * cos(theta)
y <- center.y[k] + radius.y.upper[k] * sin(theta)
theta <- seq(pi / 2, pi, length=100)
x <- c(x, center.x[k] + radius.x.lower[k] * cos(theta))
y <- c(y, center.y[k] + radius.y.upper[k] * sin(theta))
theta <- seq(pi, 3/2*pi, length=100)
x <- c(x, center.x[k] + radius.x.lower[k] * cos(theta))
y <- c(y, center.y[k] + radius.y.lower[k] * sin(theta))
theta <- seq(3/2*pi, 2 * pi, length=100)
x <- c(x, center.x[k] + radius.x.upper[k] * cos(theta))
y <- c(y, center.y[k] + radius.y.lower[k] * sin(theta))
polygon(x, y, border=NA, col=col)
}
}
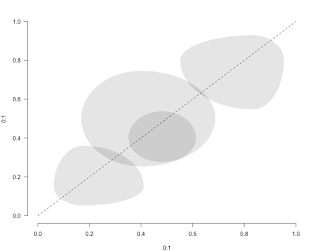
Here are some examples
ellipse(center.x = c(0.2, 0.3, 0.25), center.y = c(0.7, 0.6, 0.55), radius.x = c(0.1, 0.1, 0.1), radius.y = c(0.15, 0.2, 0.5))
ellipse(center.x = 0.5, center.y = 0.5, radius.x.lower = 0.1, radius.x.upper = 0.3, radius.y = 0.2)
ellipse(center.x = 0.6, center.y = 0.3, radius.x.lower = 0.1, radius.x.upper = 0.3, radius.y.lower = 0.2, radius.y.upper = 0.4)
males <- c(10, 25, 3, 4)
N <- c(12, 52, 17, 10)
males2 <- c(12, 20, 3, 6)
N2 <- c(15, 50, 20, 12)
bc <- HelpersMG::.BinomialConfidence(x=males, n=N)
bc2 <- HelpersMG::.BinomialConfidence(x=males2, n=N2)
plot(0:1, 0:1, xlim=c(0, 1), ylim=c(0,1), lty=2, type="l", las=1, bty="n")
ellipse(center.x = bc[, "PointEst"], center.y = bc2[, "PointEst"],
radius.x.lower = bc[, "PointEst"]-bc[, "Lower"],
radius.x.upper = bc[, "Upper"]-bc[, "PointEst"],
radius.y.lower = bc2[, "PointEst"]-bc2[, "Lower"],
radius.y.upper = bc2[, "Upper"]-bc2[, "PointEst"])
Commentaires
Enregistrer un commentaire