Example of bootstrap to estimate se of a set of data... just for fun
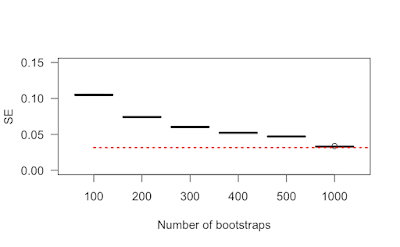
N <- 1000 A <- rnorm(N) sd(A)/sqrt(N) # Vraie valeur: 1/sqrt(N) t <- NULL for (rep in rep(c(100, 200, 300, 400, 500, 1000), 10)) { print(rep) s <- NULL for (i in 1:10000) { tirage <- sample(A, size=rep, replace = TRUE) s <- c(s, mean(tirage)) } t <- c(t, sd(s)) } dta <- data.frame(group=rep(c(100, 200, 300, 400, 500, 1000), 10), mean=t) boxplot(mean ~ group, data=dta, las=1, ylab="SE", xlab="Number of bootstraps", ylim=c(0, 0.15)) segments(x0=1, x1=7, y0=1/sqrt(N), y1=1/sqrt(N), col="red", lty=3, lwd=2) In red, the true SE. The SE estimation by bootstrap is upper biased.